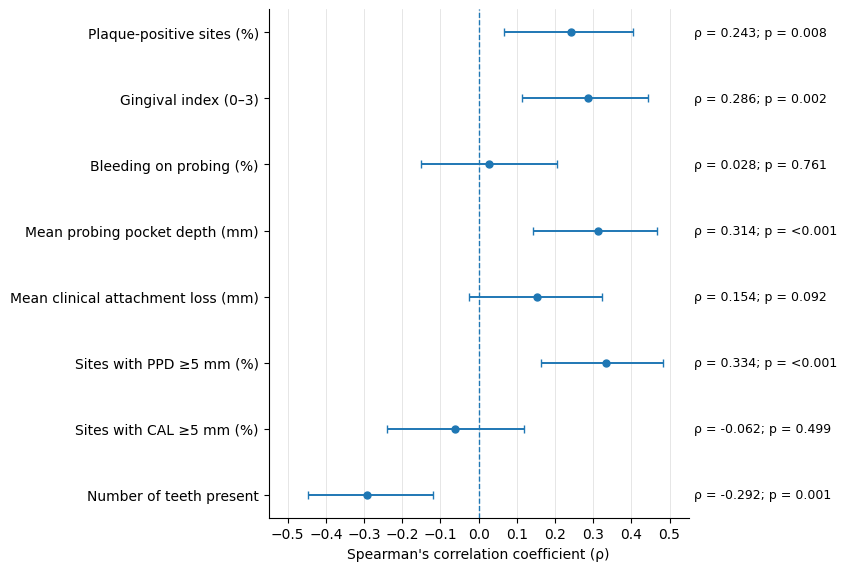
Figure 1: Correlations between HbA1c and periodontal health indicators.
Ehsan Ullah1* | Maira Kaleem2 | Zoya Ahmed2
1College of Dentistry, Nishtar Medical University, Multan, Pakistan | 2Medical Graduate, Superior University, Lahore, Pakistan
*Correspondence: Ehsan Ullah (ehsanullah4033@gmail.com)
Received: 15 September, 2026; Revised: 22 October, 2026; Accepted: 24 October, 2026; Published: 30 October, 2026
Background: Periodontitis and type 2 diabetes mellitus (T2DM) may have a bidirectional relationship. This study aimed to assess the associations between periodontal indicators and glycemic control in adults with T2DM. Methods: A total of 120 adults with T2DM participants were categorized as having adequate (HbA1c <7%) or inadequate glycemic control (HbA1c ≥7%). Spearman correlation was performed, and multivariable logistic regression was used to compare indicators of periodontal disease. Data were considered statistically significant if the p-value was <0.05. Results: Mean age was 55.19 ± 9.99 years, and median HbA1c was 7.15% (IQR: 6.40–8.20). Poor control was found to be correlated with increased plaque levels, gingival index, probing pocket depth, and percentage of sites with PPD ≥5 mm (p<0.05). A lack of control was associated with severe periodontitis (60.3% vs 32.7%; p=0.005). HbA1c was found to be positively associated with plaque, gingival index, probing pocket depth, and PPD ≥5 mm, and negatively associated with tooth count (ρ=−0.292; p=0.001). Severe periodontitis was associated with higher odds of inadequate control (AOR=6.38; p=0.009), while additional teeth were inversely associated (AOR=0.85; p=0.004). Conclusions: The poorer periodontal status was related to sub-optimal glycemic control. Further prospective studies are needed to better understand these relationships and to guide the integration of dental and diabetes care.
Keywords: Diabetes Mellitus, Type 2; Glycated Hemoglobin; Glycemic Control; Periodontal Attachment Loss; Periodontal Diseases; Periodontitis.
Periodontitis is a chronic inflammatory disease of tissues supporting the teeth caused by a growth of biofilm and can result in tooth loss, and there is a bidirectional relationship between periodontitis and diabetes 1. A systematic review and meta-analysis of cross-sectional studies revealed a significant link between hyperglycemia and periodontitis, but with a publication bias 2. Hyperglycemia could exacerbate periodontal disease by creating advanced glycation end products, changing host immune responses, oxidative stress, and pro-inflammatory signaling 3. Plaque, bleeding on probing (BOP), probing pocket depth (PPD), and clinical attachment loss (CAL) are often used to assess periodontal status in adults with type 2 diabetes mellitus (T2DM), and a Pakistani clinical study reported a positive correlation between HbA1c and BOP, PPD, and CAL 4. The authors reported that HbA1c ≥ 7% was correlated with increased plaque accumulation and changes in various periodontal parameters in 182 adults with T2DM and generalized periodontitis 5. Another cross-sectional study found that the parameters of diabetes and obesity were associated with periodontal pocket area, highlighting the importance of overall periodontal inflammatory burden 6.
There are indications from meta-analysis of randomized controlled trials that periodontal treatment may reduce HbA1c, which is determined by baseline glycemic control 7. The Cochrane review found moderate-certainty evidence that subgingival periodontal treatment resulted in improvement of glycemic control in people with diabetes and periodontitis 8. A network meta-analysis was also conducted for the antioxidants used as adjuncts to nonsurgical periodontal treatment for metabolic outcomes 9. The systematic reviews revealed that there was methodological variation among the different available systematic reviews and a moderate risk of bias across the systematic reviews, indicating the need for more well-designed clinical research 10. Comparing multiple periodontal indicators within a study population might help to elucidate the relationship between them and glycemic control due to differences in study populations, periodontal measurements, and confounder adjustment.
The purpose of this study was to evaluate the relationship between oral health variables and glycemics in adults with T2DM. It aimed to compare the periodontal measures in those with HbA1c less than 7% with those with HbA1c greater than or equal to 7%. It also explored correlations with HbA1c and adjusted associations between periodontal indicators and inadequate glycemic control.
This retrospective observational study ( January to June 2022) evaluated the relationships between periodontal clinical measures and glycemic control in type 2 DM (T2DM) adults by the existing medical/dental records. The relationship of glycated hemoglobin (HbA1c) to periodontal measures was evaluated by comparing the data with the corresponding HbA1c levels. The study was reported in accordance with the Strengthening the Reporting of Observational Studies in Epidemiology (STROBE) guidelines. The inclusion criteria for adults were: age 18 years or older and having a documented diagnosis of T2DM. Records were used in the analysis if an HbA1c result and a periodontal assessment were conducted within three months of each other. Records were excluded based on missing primary study variables, type 1 diabetes, gestational diabetes, or complete tooth loss. Additional records of periodontal treatment in the past 3 months or systemic antibiotics in the past 6 months were also excluded. Sample size was calculated through OpenEpi version 3.0.3 (released 2014, Atlanta, GA, USA) using the single-population proportion formula (n=Z2p(1-p)/d2), where (n) represents the required sample size, (Z) is the standard normal deviate corresponding to the selected confidence level, (p) is the expected prevalence based on previous literature, and (d) is the desired absolute precision 11.
All records meeting the predefined eligibility criteria were considered for inclusion until the required number of records was obtained. Duplicate records were removed, and data completeness was verified before analysis. A consecutive sampling technique was used to select 120 eligible patient records from the study period. A structured data-extraction sheet was used to collect data. The following variables were included: age, sex, duration of diabetes, treatment of diabetes, body mass index (BMI), tobacco use, oral hygiene practices, and relevant comorbidities, if available. Plaque index (PI), gingival index (GI), bleeding on probing (BOP), probing pocket depth (PPD), and clinical attachment loss (CAL) were used as periodontal indicators. The main measure of glycemic control was HbA1c.
Documented clinical assessment was used to obtain periodontal measurements. PI and GI were used to evaluate plaque accumulation and gingival inflammation, respectively. BOP was reported as the percentage of all sites that bled following probing. PPD was measured from the gingival margin to the base of the periodontal pocket, and CAL was measured from the cementoenamel junction to the pocket base. The clinical diagnosis or periodontal measurements available were used to establish the periodontitis status. All definitions were used throughout the analysis in a consistent manner. HbA1C was used to evaluate glycemic control, and the latest available HbA1C was chosen for each patient. The participants were divided into two groups: those with adequate glycemic control (HbA1c under 7.0%) and those with inadequate glycemic control (HbA1c 7.0% or higher). HbA1c was also subjected to analysis as a continuous variable to evaluate the relationship of HbA1c with individual periodontal indicators./p>
Data were analyzed in IBM SPSS Statistics 28.0 (Armonk, NY: IBM Corp.). Means and standard deviations or medians and interquartile ranges were used to summarize continuous variables as appropriate. Data for categorical variables are reported as numbers and percentages. Independent-samples t-tests or Mann–Whitney U tests compared periodontal measurements between the glycemic control groups. The relationship between HbA1c and the periodontal indicators was determined using Pearson's or Spearman's correlation. Association between categorical variables was explored using chi-square or Fisher's exact tests. Inadequate glycemic control was proposed to be associated with certain factors; this was suggested using multivariate logistic regression. Confounders considered were age, sex, diabetes duration, BMI, tobacco use, oral hygiene practice, and diabetes treatment. Adjusted odds ratios (ORs) with 95% confidence intervals (CIs) are reported. A two-sided p-value < 0.05 was chosen as statistically significant. This study is a retrospective/observational audit utilizing completely anonymized, de-identified institutional data. Because no direct human intervention or patient contact occurred, formal ethical approval was determined to be exempt by the institutional oversight committee.
The study included 120 participants. The mean age was 55.19 ± 9.99 years, while the median duration of diabetes was 9.60 years (IQR: 6.10–13.50). Of these, 62(51.7%) were male, and 58(48.3%) were female. The mean BMI was 29.43 ± 3.70 kg/m², and the median HbA1c level was 7.15% (IQR: 6.40–8.20). The median percentage of plaque-positive sites was 70.55% (IQR: 50.10–96.20), while the mean GI was 1.35 ± 0.41. BOP had a median value of 41.35% (IQR: 27.12–70.08). The mean PPD and CAL were 3.62 ± 0.87 mm and 4.33 ± 1.21 mm, respectively. The median percentage of sites with probing depth ≥ 5 mm was 25.35% (IQR: 22.60 – 28.82%), and the mean percentage of sites with CAL ≥ 5 mm was 43.07 ± 12.87%. The median number of teeth present was 19.00 (IQR: 16.00–22.00), as shown in Table 1.
| Variables (Units) | Data Representation* | Statistics |
|---|---|---|
| Male | n (%)8 | 62 (51.7%) |
| Female | n (%)8 | 58 (48.3%) |
| Age (years) | mean ± SD | 55.19 ± 9.99 |
| Diabetes duration (years) | median (IQR) | 9.60 (6.10–13.50) |
| BMI (kg/m²) | mean ± SD | 29.43 ± 3.70 |
| HbA1c (%) | median (IQR) | 7.15 (6.40–8.20) |
| Plaque sites (%) | median (IQR) | 70.55 (50.10–96.20) |
| Gingival index (0–3) | mean ± SD | 1.35 ± 0.41 |
| Bleeding on probing (%) | median (IQR) | 41.35 (27.12–70.08) |
| Mean probing pocket depth (mm) | mean ± SD | 3.62 ± 0.87 |
| Mean clinical attachment loss (mm) | mean ± SD | 4.33 ± 1.21 |
| Sites with PD ≥5 mm (%) | median (IQR) | 25.35 (22.60–28.82) |
| Sites with CAL ≥5 mm (%) | mean ± SD | 43.07 ± 12.87 |
| Number of teeth present (count) | median (IQR) | 19.00 (16.00–22.00) |
*Data are presented as frequency (percentage), mean ± standard deviation (SD), or median (interquartile range [IQR]), as appropriate. BMI = body mass index; HbA1c = glycated hemoglobin; PD = probing depth; CAL = clinical attachment loss. *Representation is applicable throughout the article where appropriate stats are reported.
Table 2 presents clinical characteristics of the 120 participants. Most participants received oral antidiabetic medication only in 70(58.3%), while 28(23.3%) reported tobacco use. Regarding oral hygiene, 63(52.5%) brushed once daily and 46(38.3%) brushed twice daily. Among participants with recorded comorbidity data, hypertension was the most common condition present in 39(42.9%), followed by hypertension with dyslipidemia in 27(29.7%) and dyslipidemia alone in 25(27.5%). Severe periodontitis was the most frequent periodontal category present in 58(48.3%), followed by moderate in 48(40.0%) and mild periodontitis in 14(11.7%).
| Variable | Category | n (%) | Diabetes treatment | Oral medication only | 70 (58.3%) | Oral medication + insulin | 33 (27.5%) | Insulin only | 15 (12.5%) | Lifestyle only | 2 (1.7%) | Tobacco use | No | 92 (76.7%) | Yes | 28 (23.3%) | Oral hygiene frequency | Once daily | 63 (52.5%) | Twice daily | 46 (38.3%) | Less than once daily | 8 (6.7%) | Three or more times daily | 3 (2.5%) | Comorbidity | Hypertension | 39 (42.9%) | Hypertension and dyslipidemia | 27 (29.7%) | Dyslipidemia | 25 (27.5%) | Periodontitis status | Severe | 58 (48.3%) | Moderate | 48 (40.0%) | Mild | 14 (11.7%) |
|---|
Plaque levels, gingival index, PPD, and CAL were significantly higher in those with inadequate glycemic control as compared to those with adequate glycemic control (p < 0.05), as shown in Table 3. There was also a significantly larger percentage of sites in the inadequately controlled group with PPD ≥ 5 mm (p < 0.001). In addition, the participants in this group had a smaller number of teeth present (p = 0.018). The groups did not show any significant differences in BOP or in sites with CAL ≥5 mm (p > 0.05).
| Periodontal indicator | Adequate control (n=52) | Inadequate control (n=68) | p-value |
|---|---|---|---|
| Plaque-positive sites (%) | 63.5 (43.4–93.2) | 81.5 (54.6–98.7) | 0.022 |
| Gingival index (0–3) | 1.24 ± 0.44 | 1.43 ± 0.38 | 0.014 |
| Bleeding on probing (%) | 41.4 (24.3–67.2) | 42.6 (29.9–74.0) | 0.641 |
| Mean probing pocket depth (mm) | 3.42 ± 0.80 | 3.78 ± 0.90 | 0.022 |
| Mean clinical attachment loss (mm) | 3.9 (3.2–4.8) | 4.6 (3.5–5.5) | 0.038 |
| Sites with PPD ≥5 mm (%) | 23.9 (19.3–26.8) | 27.0 (23.3–30.6) | <0.001 |
| Sites with CAL ≥5 mm (%) | 43.70 ± 12.10 | 42.60 ± 13.51 | 0.640 |
| Number of teeth present | 20.0 (17.0–24.0) | 18.5 (16.0–21.0) | 0.018 |
Note: PPD = probing pocket depth; CAL = clinical attachment loss. Welch independent-samples t-test was used when both group distributions were approximately normal; otherwise, Mann–Whitney U test was used. P-values are unadjusted and two-sided.
Table 4 shows that HbA1c levels were significantly positively associated with plaque-positive sites, gingival index, and mean probing pocket depth, and sites with PPD ≥5 mm (p < 0.05). The highest correlation was found at sites with a PPD ≥5 mm (ρ = 0.334). The number of teeth present was also negatively correlated with HbA1c (ρ = −0.292, p = 0.001). The correlation with bleeding on probing, clinical attachment loss, and sites with CAL ≥ 5 mm was not significant (p > 0.05).
| Periodontal indicator | Spearman’s rho (ρ) | p-value |
|---|---|---|
| Plaque-positive sites (%) | 0.243 | 0.008 |
| Gingival index (0–3) | 0.286 | 0.002 |
| Bleeding on probing (%) | 0.028 | 0.761 | Mean probing pocket depth (mm) | 0.314 | <0.001 | Mean clinical attachment loss (mm) | 0.154 | 0.092 | Sites with PPD ≥5 mm (%) | 0.334 | <0.001 | Sites with CAL ≥5 mm (%) | -0.062 | 0.499 | Number of teeth present | -0.292 | 0.001 |
Note: Spearman rank correlations were calculated between continuous HbA1c and each periodontal indicator. P-values are unadjusted for multiple comparisons.
The forest plot in Figure 1 shows the direction and the magnitude of associations between HbA1c and periodontal indicators (with positive associations for most indicators). A positive association was found for sites with PPD ≥ 5 mm, and a negative association was found for the number of teeth present. However, correlations were near zero at sites with CAL ≥5 mm and bleeding on probing, suggesting little evidence of monotonic relationships with CAL and HbA1c.
Figure 1: Correlations between HbA1c and periodontal health indicators.
Categorical characteristics were compared between the two groups (adequate glycemic control and inadequate glycemic control) in Table 5. There were no significant differences between the groups for sex, tobacco use, oral hygiene frequency, diabetes treatment, or comorbidities (p > 0.05). The severity of periodontitis was, however, different (p = 0.005), with severe periodontitis being more prevalent in those with inadequate glycemic control 41(60.3%), compared with those who had adequate glycemic control, 17(32.7%). The other group, however, had less prevalent inadequately controlled periodontitis (5(5.9%) vs. 10(19.2%)).
| Characteristic | Adequate control, n (%) | Inadequate control, n (%) | p-value |
|---|---|---|---|
| Sex | 0.291 | ||
| Female | 28 (53.8) | 30 (44.1) | |
| Male | 24 (46.2) | 38 (55.9) | |
| Tobacco use | 0.416 | ||
| No | 38 (73.1) | 54 (79.4) | |
| Yes | 14 (26.9) | 14 (20.6) | |
| Oral hygiene frequency | 0.403 | ||
| Once daily or less | 33 (63.5) | 38 (55.9) | |
| At least twice daily | 19 (36.5) | 30 (44.1) | |
| Diabetes treatment | 0.764 | ||
| Non-insulin-based | 32 (61.5) | 40 (58.8) | |
| Insulin-based | 20 (38.5) | 28 (41.2) | |
| Comorbidity (documented records only) | 0.086 | ||
| Hypertension | 23 (54.8) | 16 (32.7) | |
| Dyslipidemia | 8 (19.0) | 17 (34.7) | |
| Hypertension and dyslipidemia | 11 (26.2) | 16 (32.7) | |
| Periodontitis status | 0.005 | ||
| Mild | 10 (19.2) | 4 (5.9) | |
| Moderate | 25 (48.1) | 23 (33.8) | |
| Severe | 17 (32.7) | 41 (60.3) |
Multivariable logistic regression analysis for inadequate glycemic control is shown in Table 6. Poor glycemic control was significantly correlated with higher levels of plaque, gingival index, mean PPD, and percentage of pockets ≥5 mm with p < 0.05. Patients with severe periodontitis were also more likely to have inadequate control (AOR = 6.38, p = 0.009) than those with mild periodontitis. By contrast, the odds of inadequate glycemic control decreased with an increase in the number of teeth present (AOR = 0.85, p = 0.004). There was no significant correlation between glycemic control and BOP, CAL, sites with CAL ≥5 mm, and moderate periodontitis.
| Periodontal indicator | Contrast/increment | AOR (95% CI) | p-value |
|---|---|---|---|
| Plaque sites | per 10 percentage-point increase | 1.24 (1.07–1.45) | 0.005 |
| Gingival index | per 1-point increase | 3.59 (1.33–9.66) | 0.011 |
| Bleeding on probing | per 10 percentage-point increase | 1.02 (0.89–1.16) | 0.784 |
| Mean probing pocket depth | per 1-mm increase | 1.69 (1.04–2.75) | 0.033 |
| Mean clinical attachment loss | per 1-mm increase | 1.34 (0.96–1.86) | 0.081 |
| Sites with PD ≥5 mm | per 10 percentage-point increase | 3.90 (1.79–8.47) | <0.001 |
| Sites with CAL ≥5 mm | per 10 percentage-point increase | 0.96 (0.71–1.28) | 0.763 |
| Number of teeth present | per 1 additional tooth | 0.85 (0.76–0.95) | 0.004 |
| Periodontitis status | Moderate vs mild | 2.45 (0.64–9.35) | 0.190 |
| Periodontitis status | Severe vs mild | 6.38 (1.60–25.35) | 0.009 |
The results show that higher HbA1c levels were significantly correlated with worse periodontal status (higher plaque, gingivitis, deeper pockets, and severity of periodontitis). Several periodontal measurements were positively associated with HbA1c, and the number of teeth was negatively associated with HbA1c. On multivariable analysis, plaque levels, gingival index, probing pocket depth, deep periodontal pockets, severe periodontitis, and fewer teeth were significant factors associated with poor glycemic control.
In the current study, which analyzed data on 120 type 2 diabetic adults, the glycemic status was associated with worse periodontal status. A greater percentage of plaque-positive sites, gingival index, mean probing pocket depth, and proportion of sites with PPD ≥ 5 mm were observed, and severe periodontitis was also more prevalent, in participants with HbA1c ≥ 7% compared to those with HbA1c < 7%. HbA1c was significantly associated with plaque, gingival inflammation, pocket depth, and increased odds of inadequate control, whereas more teeth were associated with decreased odds of inadequate control. These results align with studies showing poor periodontal and oral-hygiene status in uncontrolled T2DM, and increasing periodontal inflammatory burden during the different glycemic categories 12, 13.
The most prominent pattern was related to the accumulation of plaque and pocket depth, not all the periodontal markers. The presence of plaque was still linked with poor control (AOR 1.24 per 10 PP), along with gingival index (AOR 3.59 per point). The observations of the gradient may be explained by the interaction between hyperglycemia and tissue injury through impairment of neutrophil function, advanced glycation end-product signaling, and exaggeration of cytokine-mediated tissue injury, and plaque dysbiosis as an inflammatory local trigger. Similarly, in adults with diabetic neuropathy, the severity of periodontitis was associated with HbA1c, and the severity of periodontal inflammatory responses was described as a diabetic modifier of periodontal inflammation 14. However, scores for plaque and gingival health may be linked to the patient's oral hygiene, oral health care access, tobacco use, and professional care experience as well; it is important to take into account that glycemia is not the only cause 15.
The findings at the pocket depth level confirm the correlation with periodontal breakdown, with mean probing depth, amount of deep pockets, and severe periodontitis being associated with inadequate control, even after adjusting for other factors. The inverse relationship with the number of teeth is clinically significant as tooth loss may reflect ongoing periodontal destruction, and may be a factor limiting oral hygiene. There has been a bidirectional relationship suggested in a prospective-cohort meta-analysis which showed that diabetes was associated with periodontal disease as well as periodontal disease with diabetes, but there was significant heterogeneity across studies to be directly compared 16. Lack of significant adjusted associations for BOP, mean CAL, and sites with CAL ≥5 mm implies that patterns of current HbA1c and inflammation and historical destruction are not the same. BOP is a site-level measurement and may vary with examination technique and from day to day, whereas CAL is a measurement of past tissue destruction 17. The overall body of evidence is consistent with an integrated approach to dental and diabetes care, although it does not suggest a one-way causal interpretation. In a separate 6-month meta-analysis, glycemic effects were also observed, with differences in effect size and heterogeneity across trials 18.
A summary of periodontal therapy and insulin resistance indicated a possible metabolic pathway, but failed to demonstrate that periodontal indicators were a direct cause of hyperglycemia, independent of each other 19. As such, the estimate for severe periodontitis (AOR 6.38) in this analysis is to be interpreted as an association, and the size of the effect may vary due to the use of correlated measures of periodontal status in the same regression model. Intervention studies suggest that there may be effects on both periodontal and glycemic parameters, but not consistently. A review of adjunctive laser techniques reported improved probing-depth results and suggested a positive effect on attachment levels, but with less evidence 20. In a small intensive-control study, there was a reduction in the inflammatory surface area of the periodontal surface after glycemic improvement 21. A network meta-analysis was conducted to determine if baseline diabetes control influences periodontal-treatment outcomes, and randomized trials compared nonsurgical treatment strategies and adjunctive antibiotics in T2DM with periodontitis 22, 23.
The present retrospective cross-sectional data cannot establish temporality, and the size of the sample and residual confounding. Standardized periodontal assessment, larger sample size, and parsimonious regression models that consider potential collinearities and include combination therapies of periodontal and diabetes care should be considered for future prospective studies.
The current study concluded that sub-optimal glycemic control was correlated with more plaque, inflammation of the gums, deeper periodontal pockets, and worse periodontal disease. Increased HbA1c levels were associated with several measures of periodontal disease, and an increased number of teeth was associated with decreased risk of sub-optimal control. These results emphasize the need to address the periodontal health aspects of diabetes care and routine oral health evaluation and screening. Further prospective analysis with larger cohorts, standardized measures, and rigorous adjustment for potential confounders will better establish the temporality and assess the benefits of integrated dental-diabetes care.
This work is published by Multidisciplinary Scholarly Advancement and Research MSAR Institute. © 2026 The Author(s). The full terms of Journal Publishing policies are available at https://msarjournals.com/index.php/index/open-access and incorporate the Creative Commons Attribution – Non Commercial (CC BY-NC 4.0) License https://creativecommons.org/licenses/by-nc/4.0/. By accessing the work you hereby accept the Terms. Non-commercial uses of the work are permitted without any further permission, provided the work is properly attributed. Publisher’s Note: MSAR Institute remains neutral with regard to jurisdictional claims in published maps and institutional affiliations, and assumes no liability for the scientific accuracy or clinical efficacy of the content herein, as they rest entirely with the authors.